In my previous post I promised to delve a little deeper into some of the subject matter I had to tackle as I embarked on my AI learning journey. You may recall that I had defined some goals for myself, and a series of steps I would take to give me the knowledge I needed to get there. Just meat and potatoes type of knowledge. Just to recap a little, my goal is basically this:
I want to learn enough about AI that I can work closely with people who are developing AI products and people who need AI products. I need to understand what the capabilities and limitations of AI are and how to connect those to the needs that exist out there in the industry. I also want to understand what the deployment challenges are going to be and how to overcome them. I want to do this from a strong technical foundation, but not necessarily at the level of an AI scientist or hardcore engineer.
I determined that I would develop this knowledge by taking myself through a series of learning steps. Roughly speaking, these steps were:
- Deepen my knowledge of data science and classical machine learning
- Learn how neural networks work and how they are built, trained, validated, and deployed.
- Get involved in a hands-on project that involves generative AI and LLMs.
So I started with data science and classical machine learning, and today I’m going to tell you about some of the things about it I think are key, from my perspective. I’m going to use a few code examples here and there. AI is a technical topic and we are going to have to get technical. If you don’t yet feel comfortable with code, feel free to ignore it. This blog post is a bit on the long side, but it’s a lot shorter than all the work that I had to do to learn these things. May it prove to be a useful reference for you.
Data Science and AI
It is obvious, but it still needs to be said. Without great data, AI is impossible. If I want to make a career in AI, especially a career in bringing AI to market and enabling people to leverage the power of AI to do useful things, I have to get pretty comfortable with data science. It’s foundational and essential. Fortunately for me, this learning journey was not my first brush with data science. But by being intentional and focusing, I learned a lot. I’m not a data scientist, but in my own mind I’ve systematised data science somewhat so I can wrap my head around it. One of the first things I had to make sure I was comfortable with are the tools of data science.
Tools
By no means is this a comprehensive list of tools, but these are the basic tools of data science. I did a lot of my learning in Python, and many data scientists use Python extensively (as well as another language called R). I hope that you will not shy away from learning a little python. You should at least try to learn how to do some basic data analysis with it. If you do, you will quickly run into the following Python libraries and tools:
- Numpy – a library that handles data arrays. It’s useful because it lets you operate on entire arrays using arithmetic and other functions.
- Pandas – a library that expands on Numpy to introduce the concept of a Dataframe. Dataframes are bread and butter object types of data scientists. They are very similar to spreadsheets but are used within the Python programming language as a datatype.
- Matplotlib – this is a library that lets you create plots and visualisations in Python. Getting a look at your data is a key part of understanding it.
- Seaborn – A powerful expansion on the capabilities of Matplotlib. It makes it easy to create gorgeous data visualisations.
- Scikit Learn – This is a Machine Learning toolkit that provides incredibly powerful capabilities.
There is an excellent course on Udemy which takes you through Python basics and introduces you to all the tools you will need to get started with data science and machine learning: Python for Data Science and Machine Learning Bootcamp. I bought this course for my entire team in a previous job, and all of them gained tremendous value from it. I revisited it myself recently and it’s still fantastic.
Something else that is used extensively is Jupyter / Google Colab – these are Notebook tools that let you write little bits of code and interact with them on the fly. Very very useful to prototype data manipulation functions and throw up quick visualisations of the data you’re working with.
Data Acquisition
In my career as a network automation specialist, getting access to data was always the toughest part. Automation systems depend on the quality and quantity of their data, and this is even more critical for AI. The first key aspect of data science is gathering data, which can feel more like an art than a science.
To start:
- What kind of data do I need to collect in order to draw the insights I am looking to draw?
- Where can I get this data and who do I need to talk to about getting access to it?
You will probably spend a huge portion of your time just trying to get past these two points when you get started. Even if you are planning to use a pre-trained AI system (a system that has already been exposed to a massive amount of data so that it develops some set of skills) in your project, you’ll likely want to feed specific data to that system for finer-grained tasks.
Gaining access to data – getting permission to use it, having the ability to refresh it and augment it. This can be SO hard. Organizations often have strict rules and people dedicated to protecting data. For example, analyzing patient data involves regulatory barriers, and customer data may involve NDAs. Assembling data from various sources can be difficult. I can’t tell you how often I’ve worked with customers who had no idea where the data I needed was, or who was in charge of it.
Thought experiment: You want to understand what percentage of encounters between humans and bears in the wild result in death or serious injury. The calculation is simple. But where is that data? Your job depends on this. Where is the data? For every state, province, country that has bears, the answer will differ. And will they be keeping track of all encounters or just the noteworthy ones? Does the data you need even exist?
Fortunately for me, as I was doing my learning, I discovered that there are some widely available sample data sets that people can use for learning and testing.
Some of the best sites I’ve found have been:
- Kaggle – this site is a very valuable resource all around for all things AI and Machine Learning
- Data.gov – the US government actually publishes huge amounts of data and it can all be used for free
- Tableau – it’s somewhat self-serving since they have data visualisation product but they offer conveniently organised data sets.
Those are just 3 examples. You can find many more with a simple search.
Data Analysis/Evaluation/Visualisation
Assuming they have acquired data, a data scientist will then spend quite some time examining that data to make sure that it’s suitable for its intended uses. When I started trying to understand data science, I was actually quite confused by this step. I knew I needed good data, but I wasn’t sure where to start. Well, I gathered a few questions that I started to take with me into every data evaluation I did. The list doesn’t cover all the things I’d need to check, but it really does provide a good starting point in my experience. The basic questions are:
- Data Volume: How many rows and columns do I have?
- Data Types: What are the data types for each column (e.g., text, numbers)?
- Value Distribution: How are the values distributed? How many unique values are there? Which values are most frequent?
- Missing Data: Are there gaps in the data? Any missing cells or rows? How should missing data be handled?
- Numeric/Categorical: Are some data points numerical and others categorical?
- Example: I may have a field called “occupation”. That’s a category. I may have another field called “weight”. That’s numerical. This is important later.
- Data Order: Is the data ordered or shuffled?
- Normalisation: Does any of the data need to be normalized? (more on this later)
- Categorical Data: Does any categorical data need manipulation? (more on this later)
- Relevance: Is any data irrelevant? Can it be dropped?
- Correlations: Are there any correlations between different parts of the data when plotted?
- Categories: Can the data be easily split into categories?
- Training data: If my data is training data, meaning my data consists of a bunch of inputs and an expected output:
- Do I have about the same number of each kind of possible output? Or do I have way more of some outputs than others?
- How are my outputs (or outcomes) distributed? Linearly (eg: expected temperatures)? Binary (eg: pass/fail)? Multi-categorical (eg: types of clothes)?
This checklist has helped me understand my data better and determine if it’s usable. It’s a great start, even before diving into domain-specific knowledge. For example, with aeronautics data, you’d eventually need to know if the data is valid within that field. But for general evaluation, these questions cover a lot of ground.
Using this publicly available data set, here is how you would answer the first few questions above if you had data that was in CSV format:
import numpy as np
import pandas as pd

my_data = pd.read_csv("cleaned_data_Task1.csv")
# Just print the first few lines of our data to see what it looks like
my_data.head()
# Check and see the data types for what's in my data set and see how complete it is.
my_data.info()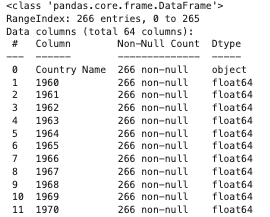
I truncated the above a little but you can see it’s telling me that column 1 is an object and the other columns contain a floating point number. Since the table has 266 entries, it’s good to see that I don’t have any null values in any of the columns.
# Get some general sense of the range and spread of my numerical data
my_data.describe()
In the table above I can get a quick sense of average population for all countries over the years, for example. I can also see that standard deviation is increasing over the years which indicates to me that some countries are growing much faster than others.
After characterising data, the next thing is getting some sort of a look at it. I could write an entire blog post on visualising data, and in fact I will. So stay tuned for that!
Data Cleanup and Formatting
When I started with data cleanup and formatting, I realized there was a lot more to learn than I initially thought. It sounds straightforward, but there’s a lot to consider. For example, is blank data the same as null data? Is a zero the same? Data sources can be flawed, so the answers aren’t always clear.
When I started with data cleanup and formatting, I realized there was a lot more to learn than I initially thought. It sounds straightforward, but there’s a lot to consider. For example, is blank data the same as null data? Is a zero the same? Data sources can be flawed, so the answers aren’t always clear.
Here are a couple of examples of data cleanup:
# Replace null entries with 0 example
my_data['1960'].fillna(0,inplace=True)

# Shuffle data that is ordered so it's random
from sklearn.utils import shuffle
shuffled_data = shuffle(my_data)
That’s all pretty cool, but where I learned the most during my exploration is on the subject of data normalisation. This turns out to be especially important later, when we will talk about neural networks and how they are trained. But data normalisation is just a very basic and important step in preparing data for advanced analysis. So what is it?
Normalisation
Consider a dataset recording people’s ages and heights. Ages range from 0 to 122 years, while heights range from 0 to 272 cm. The different scales can introduce bias, with height potentially influencing the model more due to its larger range. Normalizing these values to a common scale, like 0 to 1, preserves their relative differences and prevents one feature from dominating due to its scale.
Here is an example using a very small sample data set I created:
import pandas as pd

# Read in the data
my_data =  pd.read_csv('names-ages-heights.csv')
my_data.describe()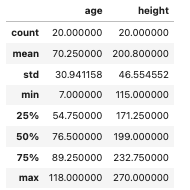
You can see in the data set, ages range from 7 to 118, heights range from 115 to 270.
# Normalize the data so everything is in the same order of magnitude while preserving proportion
from sklearn.preprocessing import MinMaxScaler
scaler = MinMaxScaler()
my_data_scaled = scaler.fit_transform(my_data.drop('name', axis=1))  # Only going to process the numerical data
print(my_data_scaled)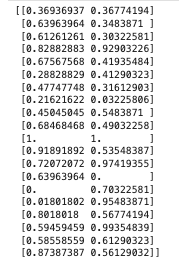
You can see the two columns of data from the dataframe have been converted to a 2-dimensional array here, but the important piece is that all the values are now between 0 and 1 while maintaining proportion.
That’s normalisation. On the normalised scale, a 122 year old person would have an age value of 1. And a 272cm tall person would have a height value of 1. But if you were to plot the height or age values, you would see them distributed exactly how the original values were. There are some caveats here because normalisation happens on available data and the scale is set by available data. So if you don’t have any 122 year olds in your data set, 1 will simply be equivalent to whatever the age of your oldest person is. But dealing with this is maybe beyond the scope of this post.
OneHot Encoding
OneHot Encoding, or “binary encoding” or “indicator encoding” is something I had never even heard of before. But it makes sense. In fact if you’ve ever built a PowerPoint slide that compares different products, for example, you may have actually done this kind of encoding without even realising it. So what is it? Well, let’s say you have data where one of your columns contains category data. So let’s say in our above list of people, their ages and their heights, we add something like their favourite flavour of ice cream. The way it might look in a table is like this:
| Name | Age | Height | Favourite Ice Cream |
| Joe | 31 | 183 | Vanilla |
| Mary | 27 | 162 | Pistachio |
| Deepak | 44 | 179 | Chocolate |
It turns out that sometimes, that categorical type of data column might be hard to deal with. In particular your data processing might have a hard time dealing with non-numerical values. You could assign a number to each flavour, like vanilla = 1 and chocolate = 42, but then later on those numbers might be misinterpreted as magnitudes of some kind instead of just category labels. So OneHot encoding is when you do this:
| Name | Age | Height | Vanilla | Pistachio | Chocolate |
| Joe | 31 | 183 | 1 | 0 | 0 |
| Mary | 27 | 162 | 0 | 1 | 0 |
| Deepak | 44 | 179 | 0 | 0 | 1 |
Doesn’t this look a little like a feature comparison table? Since Joe like vanilla, he has a 1 in the vanilla column and a 0 in the others. And so on. This turns out to be a much better way to represent category data when you are training a neural network, for example. And you know, even we humans tend to like this way of representing categories. It lets us do things like count up the total value of column “vanilla” to get a quick idea of how many people like vanilla.
I should mention that if there are only those 3 types of ice cream, we technically don’t need all three of those category columns. We could drop the column called “vanilla” for example, and deduce that anyone who doesn’t have a 1 in either “pistachio” or “chocolate” must therefore be a fan of vanilla.
There are numerous ways to do this in Python. Here are two of them which you can try with another sample data set:
# Pandas method:
favourite_icecream_dummies = pd.get_dummies(my_data['favourite_icecream'], drop_first = True, dtype=int)
# then just drop 'category_name' from the original df and concat this new df to replace it

# Harder method:
from sklearn.preprocessing import OneHotEncoder
onehotendcode = OneHotEncoder()
encoded_array = onehotendcode.fit_transform(my_data[['favorite_icecream']]).toarray()
# then turn this back into a df, reset the index of the original df, remove the encoded column and concat
encoded_df = pd.DataFrame(encoded_array, columns=onehotencode.get_feature_names_out(['favorite_icecream']))
my_data.reset_index(drop=True, inplace=True)
encoded_df.reset_index(drop=True, inplace=True)
my_data_encoded = pd.concat([my_data.drop('favorite_icecream', axis=1), encoded_df], axis=1)
Try these out and see what you get.
Wrapping Up
I covered a lot of material in this post. But I’m trying to keep to the parameters I defined earlier. These concepts, I believe, really are the absolute bare minimum I needed to be comfortable with on the subject of data science if I wanted to work with data scientists and AI people. They live and breathe this stuff and if I don’t understand what it means to normalise data or what kind of challenges an organisation can face when dealing with large data sets, then I am blind and have no real hope of being anything more than a wind bag in their eyes. I am still not a data scientist. But I’ve learned, and it wasn’t that hard. I skipped all the math (and there is a lot of math). I just focused on the very meat and potatoes type of work that must be done.
Next time, I hope the post will be a little shorter. I will focus on some data visualisation tips and tricks that I learned. I hope this proves useful to you. If I’ve missed anything or misstated anything, please comment and set me straight. I’m here to learn. What have you learned about data science that you can share with me?
I look forward to sharing more about my adventures on the next instalment of the Great AI Reboot!




Hi Rached great post, as you mentioned when I start my own AI reboot, I had the same situation, just after working on some assignments (small projects) I realized that having good data set was a most if we want to have a good model performance that can provide what we expect from them. Data analysis and treatment is fundamental to achieve a good model performance, as you have mention you need to understand the data, and decid elf you can drop some features, find duplicates, find missing values and how you will treat them drop them, infer a value (use mean or median or mode to infer value) this will depend on use case and data type, identify outliers that can affect your AI model, how to treat outliers, drop, infer a new value, etc.
Also is important to execute a univariate and bivariate analysis using some graphs (histograms, box plots, bar plots, stack bar plots, etc) to understand and find relations between data features and also find positive or negative correlations using heat maps, between features.
Finally mention that other problem we should identify is if the dataset is unbalanced, some times when we have data for example from helathcare where we want to predict if a person would develop a decease or in Bank if a person would execute a fraud, the datasets have 90% or more cases where the person has no desease or not made fraud, and few cases were is positive (desase or fraud) the can led to low performance,ance when using models with new unseen datasets so for that is important to decide if is valuable to balance datasets dropping some of the data that belong to the higher percentage or augment the data that is failing on low percentage creating synthetic data, hope this post helps and contribute.
Later we can talk about model fine tuning and how to get the more important features for the model so we can focus on the data that is most relevant.
Looking forward for next posts my friend.
Thank you again for the comment, Francisco. I’m glad to see that we agree on so much! And yes, I intend to cover accuracy matrices in an upcoming post because I found that measuring accuracy of predictions is one of the most subtle aspects of data analysis!